Technical analysis is a powerful tool employed by traders and investors to navigate the complex world of financial markets. It involves the study of historical price charts, patterns, and various technical indicators to make informed trading decisions. By understanding the principles and techniques of technical analysis, traders can gain valuable insights into market trends, potential entry and exit points, and the overall health of the market. In this article, we will delve into the world of technical analysis, explaining its core concepts and how it can be effectively used to enhance your trading strategy.
Understanding Technical Analysis
Technical analysis is built on several core principles that form the foundation of this discipline:
- Price Discounts Everything: The fundamental premise of technical analysis is that all information, whether it be economic, political, or psychological factors, is already reflected in the price of an asset. This means that everything you need to know to make a trading decision can be found in the historical price chart.
- Price Moves in Trends: Another central tenet is that price movements are not random; they tend to follow trends. This means that once a trend is established, it is more likely to continue than to reverse. Technical analysis helps identify these trends and assess their strength and potential duration.
- History Tends to Repeat Itself: Technical analysis assumes that history has a tendency to repeat itself due to human psychology and market behavior. Therefore, by examining past price patterns, traders can gain insights into what may happen in the future.
Key Elements of Technical Analysis
To effectively utilize technical analysis, it’s important to be familiar with its key components:
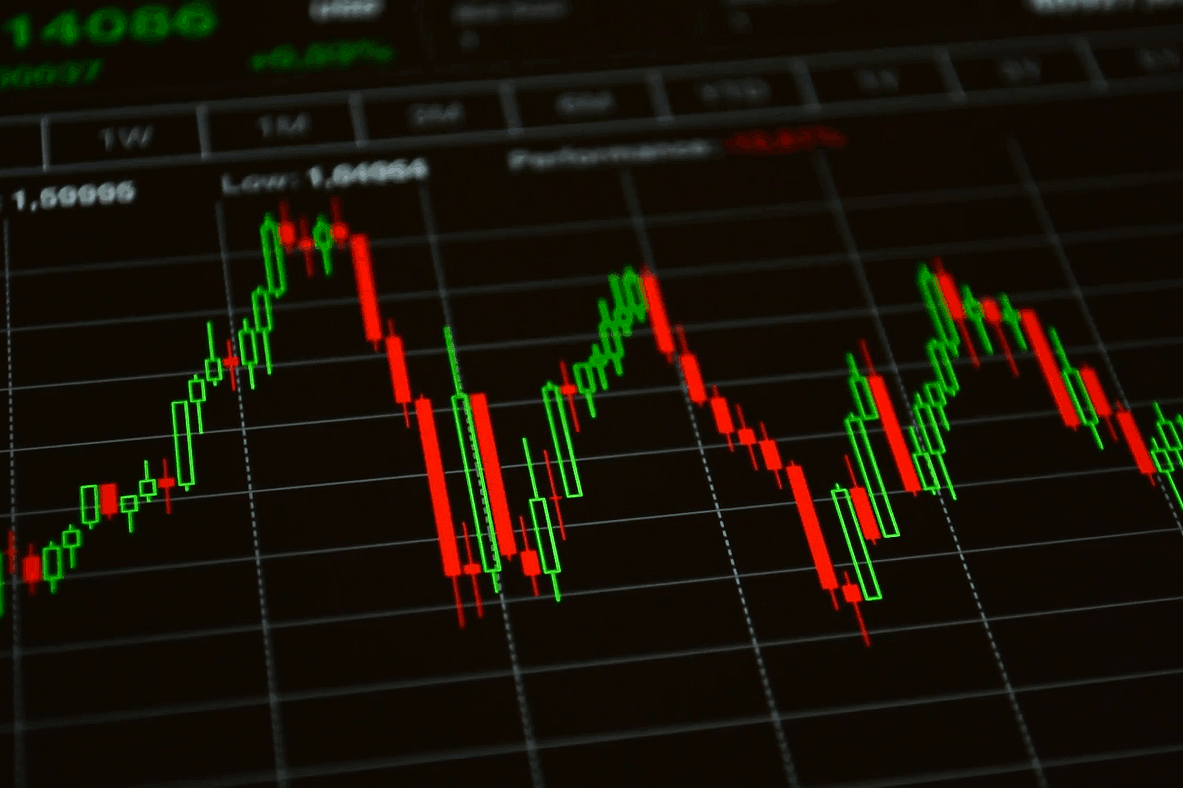
- Price Charts: Price charts are the primary tools in technical analysis. The most common types are line charts, bar charts, and candlestick charts. These charts display historical price movements over various time frames, allowing traders to identify patterns and trends.
- Support and Resistance Levels: Support levels are price levels at which an asset tends to find buying interest and move higher, while resistance levels are price levels at which selling interest tends to emerge, causing prices to decline. Identifying these levels is critical for understanding potential price movements.
- Chart Patterns: Chart patterns are specific formations that occur on price charts, such as head and shoulders, double tops and bottoms, flags, and pennants. Recognizing these patterns can provide insights into the potential direction of price movements.
- Technical Indicators: Technical indicators are mathematical calculations based on price, volume, or open interest. Common examples include moving averages, Relative Strength Index (RSI), and MACD (Moving Average Convergence Divergence). These indicators help traders gauge the strength and momentum of price trends.
- Trendlines: Trendlines are used to identify and confirm trends. They are drawn by connecting the lows in an uptrend and the highs in a downtrend. Trendlines can help traders make decisions about entry and exit points.
Applying Technical Analysis to Trading
Now that we’ve covered the basics of technical analysis, let’s explore how it can be practically applied to enhance your trading strategy:
- Identifying Trends: The first step in using technical analysis is to identify the prevailing trend in the asset you’re interested in. This can be done by analyzing price charts and looking for patterns of higher highs and higher lows in an uptrend or lower highs and lower lows in a downtrend.
- Using Support and Resistance: Support and resistance levels provide valuable information about potential price reversals. Traders can use these levels to determine entry and exit points. For example, entering a long position near a strong support level or shorting near a robust resistance level can be a part of your strategy.
- Utilizing Chart Patterns: Chart patterns can be used to forecast potential price movements. For instance, a “head and shoulders” pattern often signals a trend reversal, while a “flag” pattern suggests a continuation of the current trend. By recognizing these patterns, traders can make informed decisions.
- Incorporating Technical Indicators: Technical indicators provide additional insight into market conditions. For example, the RSI can indicate overbought or oversold conditions, and the MACD can highlight momentum shifts. These indicators can be used to confirm other technical analysis signals.
- Setting Stop-Loss and Take-Profit Orders: Technical analysis can assist in determining appropriate levels for setting stop-loss and take-profit orders. Traders can use support and resistance levels, trendlines, or indicators to establish these crucial risk management tools.
- Regular Analysis and Review: The market is dynamic, and technical analysis is not a one-time exercise. Regularly analyzing price charts, patterns, and indicators is vital for staying up-to-date with market developments and making adjustments to your trading strategy.
The Limitations of Technical Analysis
While technical analysis is a valuable tool, it’s important to acknowledge its limitations. Technical analysis is not foolproof and cannot predict future market movements with certainty. It’s a probabilistic approach that provides guidance but doesn’t guarantee outcomes. Additionally, it may not consider fundamental factors that can significantly impact an asset’s price, such as economic data, company earnings, or geopolitical events.
In conclusion, technical analysis is a potent tool for traders looking to make informed decisions in financial markets. By understanding the core principles and key elements of technical analysis, traders can gain valuable insights into market trends and potential price movements. However, it should be used in conjunction with other forms of analysis and risk management strategies to build a well-rounded trading approach. Consistent practice, education, and discipline are essential for mastering the art of technical analysis and using it to enhance your trading strategy.

