Introduction
In the world of financial markets, breakout trading remains one of the most potent yet misunderstood strategies. It promises significant returns by riding the momentum that follows the breach of established price levels. However, for every successful breakout, countless fakeouts leave traders frustrated, caught in whipsaw price action that contradicts initial expectations. Understanding the anatomy of a breakout is not just helpful—it is essential for anyone aiming to master technical trading.
This article offers an in-depth look at the dynamics of breakout trading, how to identify valid breakouts, distinguish them from traps, and use proven strategies to maximize profits while minimizing risk.
Understanding What A Breakout Is?
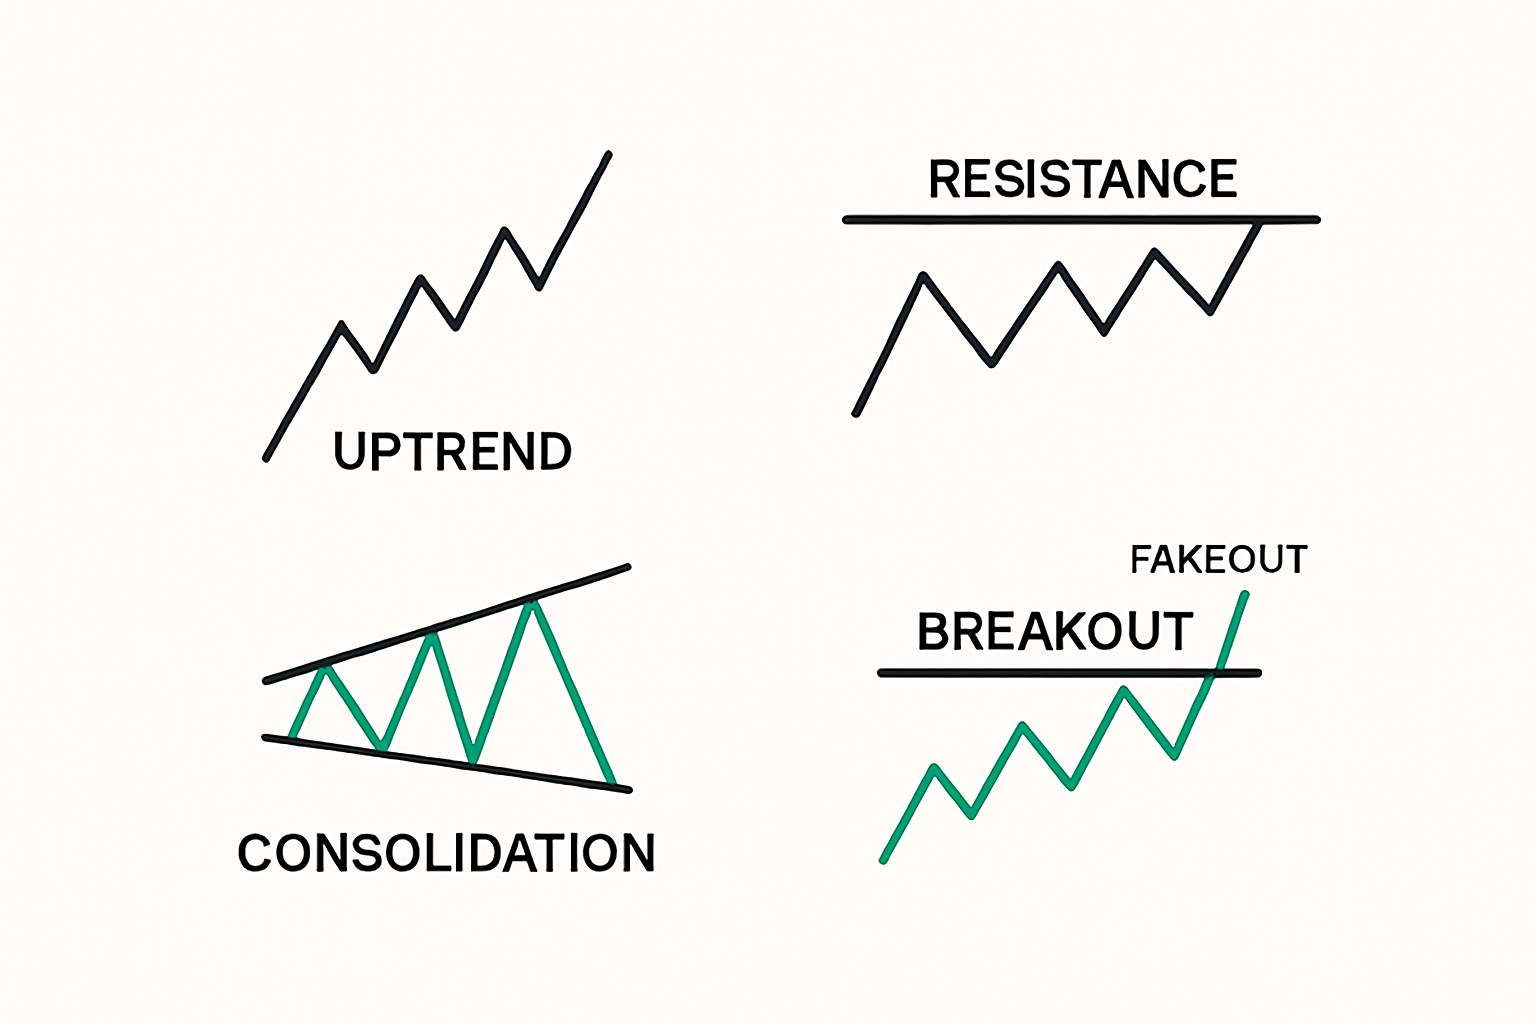
At its core, a breakout occurs when the price of an asset moves outside a defined level of support or resistance with increased volume. This movement often signals a potential trend continuation or a trend reversal, drawing interest from momentum traders. Breakouts can be bullish or bearish. A bullish breakout happens when the price moves above resistance, while a bearish breakout occurs when the price drops below support.
Breakouts are key moments because they often signify a shift in supply-demand balance. When price breaks through resistance, it means buyers have overwhelmed sellers. Conversely, a drop below support suggests sellers have gained control.
The Psychology Behind Breakouts
Price patterns are not just technical—they reflect collective market psychology. Resistance zones are areas where sellers have previously stepped in, and support zones are areas where buyers dominate. When these zones break, it often signals a psychological shift.
A breakout above resistance can spark fear of missing out (FOMO), attracting late buyers and amplifying the move. On the other hand, a false breakout—where price moves past a level briefly and then retreats—often indicates market manipulation or low conviction. Understanding trader psychology is key to interpreting price behavior around breakout zones.
Key Characteristics Of A Valid Breakout
To differentiate between real and false breakouts, traders need to consider several characteristics. A valid breakout typically includes:
1. Strong Volume
Volume is arguably the most critical confirmation tool. A breakout accompanied by a sharp rise in volume indicates strong interest and commitment. Conversely, low-volume breakouts are prone to failure as they lack trader participation.
2. Clear Chart Structure
Breakouts are more reliable when they occur after a well-defined consolidation pattern such as a triangle, rectangle, wedge, or flag. These structures represent a build-up in tension, which, when released, often leads to sharp price movements.
3. Sustained Momentum
Once a breakout occurs, price should ideally sustain the move by forming higher highs (in a bullish case) or lower lows (in a bearish case). Immediate retracement back into the pattern is a red flag.
4. Confluence with Other Indicators
Breakouts that align with technical indicators like moving averages, RSI divergence, or Fibonacci levels often carry more weight. When multiple signals converge, the breakout is more likely to succeed.
The Anatomy Of A False Breakout
False breakouts, or “fakeouts,” occur when price breaches a key level but quickly reverses and returns to its prior range. These traps often stop out breakout traders who enter prematurely. Understanding why fakeouts happen is essential.
1. Stop Hunting by Market Makers
Large institutional players may push prices beyond obvious levels to trigger retail stop-losses, absorb liquidity, and then reverse the market in their favor.
2. Low Liquidity
Breakouts that occur during off-hours or in low-volume environments are unreliable. Lack of participation means there’s insufficient follow-through to sustain the breakout.
3. News-Induced Volatility
Economic releases or geopolitical headlines can cause temporary price spikes. These may look like breakouts on lower timeframes but often revert quickly once the news impact fades.
4. Weak Technical Structure
Breakouts from ambiguous or poorly formed patterns are more prone to fail. If the support or resistance level isn’t well-tested, price may not respect it consistently.
How To Spot A Genuine Breakout?
Knowing the theory is one thing, but applying it in real time is where most traders struggle. Here are the practical steps to identify genuine breakout setups.
Step 1: Identify Strong Support and Resistance Levels
Use multi-timeframe analysis to locate levels that have been tested at least three times. The more times a level is tested, the more significant it becomes.
Step 2: Wait for Consolidation Near the Breakout Zone
Consolidation suggests that the market is coiling up for a big move. A tight trading range near a resistance or support level is often a precursor to a breakout.
Step 3: Look for Volume Confirmation
Volume should increase at the moment of breakout. Use volume histograms or indicators like the On-Balance Volume (OBV) to confirm.
Step 4: Use Candlestick Confirmation
Price action, especially strong engulfing candles or pin bars rejecting the broken level, offer visual clues. These patterns give confidence to traders entering the market.
Step 5: Watch for Retests
One of the most reliable signs of a genuine breakout is a retest of the broken level. If the price returns to test the former support/resistance and holds, it’s a good confirmation signal.
Common Breakout Patterns To Trade
Several chart patterns offer high-probability breakout opportunities. Let’s review a few of the most trusted structures:
1. Ascending and Descending Triangles
These are continuation patterns. An ascending triangle signals a potential bullish breakout as the price makes higher lows against a flat resistance. Descending triangles are the opposite.
2. Rectangles (Range Breakouts)
These form when price oscillates within a horizontal band. The breakout occurs once price exits the range with conviction.
3. Flags and Pennants
These are short-term continuation patterns that follow strong moves (poles). Breakouts from flags and pennants often result in aggressive price continuation.
4. Cup and Handle
A bullish reversal pattern where the “cup” is a rounded bottom and the “handle” a consolidation before breakout. These patterns can precede long upward trends.
Timeframes Matter: Intraday Vs Swing Trading
Breakout reliability depends significantly on the timeframe. Lower timeframes (5min, 15min) are more prone to false signals due to market noise and lack of liquidity. Higher timeframes like the 4H, Daily, and Weekly offer more stable breakout signals but fewer trading opportunities.
Day traders often use momentum strategies on 1H or lower timeframes, while swing traders prefer daily setups that provide larger moves and better risk-reward ratios.
Entry And Exit Strategies For Breakout Trading
A well-defined plan for entries and exits can significantly improve trading outcomes. Here’s a breakdown of breakout strategies:
Breakout Entry Options
Aggressive Entry: Enter at the moment the price breaks through a key level. Requires high confidence and often includes tight stop-losses.
Conservative Entry: Wait for a retest of the broken level. This approach reduces the chance of being caught in a fakeout.
Stop-Loss Placement
For bullish breakouts: place stops just below the breakout level or the last swing low.
For bearish breakouts: place stops above the breakout point or recent swing high.
Profit Targets
Use measured move techniques (e.g., the height of the pattern projected beyond breakout point).
Fibonacci extensions and prior resistance/support levels can guide exit points.
Trailing Stops
To maximize gains, use trailing stops as price moves in your favor. This allows the trade to remain open during a strong trend while locking in profits.
Tools And Indicators That Support Breakout Trading
In addition to price action, many traders use technical indicators to enhance their analysis:
Volume Indicators: On-Balance Volume (OBV), Volume Oscillator.
Moving Averages: 20 EMA and 50 EMA crossovers often support trend confirmation.
RSI and MACD: Identify divergence and overbought/oversold conditions around breakout zones.
Bollinger Bands: Squeezes can signal a breakout is near.
ATR (Average True Range): Helps define breakout volatility and stop-loss buffer zones.
Backtesting And Journaling Breakout Trades
Trading breakouts without validation is a recipe for inconsistency. Before risking capital, traders should backtest strategies using historical data. Software like TradingView, MetaTrader, or Python-based backtest engines can help simulate performance.
Additionally, keeping a trading journal is invaluable. Record every breakout trade—win or loss—with notes on entry, exit, pattern, volume, and your reasoning. Over time, you’ll see patterns that reveal your strengths and weaknesses.
Risk Management In Breakout Trading
Even the best breakout setup can fail. Without proper risk management, a single loss can offset several wins. Stick to these principles:
- Risk only 1–2% per trade.
- Set maximum daily loss limits.
- Avoid over-leveraging.
- Adjust position size based on volatility and ATR.
Professional traders often use a combination of hard stops and mental stops, scaling into positions only after confirmation.
Trading Breakouts Across Markets
Breakout strategies are not limited to forex—they work across all liquid markets: stocks, commodities, indices, and cryptocurrencies. However, breakout behavior varies:
Forex: Best breakouts often occur during market openings or economic news releases.
Stocks: Earnings season and pre-market gaps provide explosive breakout opportunities.
Crypto: Breakouts can occur at any time due to the 24/7 market structure. Volume spikes and social sentiment drive crypto breakouts.
Indices: Tend to follow macroeconomic indicators; breakouts are smoother and often aligned with economic sentiment.
Final Thoughts
Breakout trading requires a mix of technical expertise, psychological discipline, and strategic timing. Many traders chase every price movement, but those who wait for confirmation and manage risk excel in the long term.
The key is consistency. Focus on patterns that align with your trading personality, master volume analysis, and refine your timing through screen time and journaling. Breakouts can deliver high-probability entries—but only to those patient enough to wait for the right setup.

